Rafi – Strat Scanner for Trading View
$50.00 $35.00
Delivery: Within 7 days
Description
Rafi – Strat Scanner for Trading View
If you would like to simplify finding setups, and saving a TON of time going through multiple time frames, and symbols; this indicator is for you.
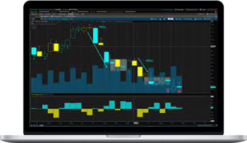
This indicator looks for candle combinations that are used to find setups based on “The Strat” candle combinations. It looks for outside bars (3), directional bars (2), inside bars (1), hammer, and shooter candles.
It scans the time frame you are currently on, applies that time frame to the other tickers and lets you know if those symbols have the setup or not on the time frame you are on. This is labeled by the green or red name of the setup showing up on the dashboard/panel.
The “hammer threshold” can be adjusted to show hammer /shooter candles with a smaller or bigger body to wick ratio.
This indicator is not an end-all-be-all for stock market investing. There are significant risks involved with trading stock, options, futures, and any other derivatives. Past performance does not guarantee future success. This indicator is for educational purposes only.
There are many courses and lessons you will need to learn to further your financial education. I hope this indicator helps someone who has no understanding on how to create a watchlist, and makes it easier to find setups not only for swinging, but for day trading as well.
What You’ll Learn In Strat Scanner for Trading View
Edit the symbols in the settings to customize your dashboard
More courses from the same author: Rafi
Delivery Policy
When will I receive my course?
You will receive a link to download your course immediately or within 1 to 21 days. It depends on the product you buy, so please read the short description of the product carefully before making a purchase.
How is my course delivered?
We share courses through Google Drive, so once your order is complete, you'll receive an invitation to view the course in your email.
To avoid any delay in delivery, please provide a Google mail and enter your email address correctly in the Checkout Page.
In case you submit a wrong email address, please contact us to resend the course to the correct email.
How do I check status of my order?
Please log in to TradingAZ account then go to Order Page. You will find all your orders includes number, date, status and total price.
If the status is Processing: Your course is being uploaded. Please be patient and wait for us to complete your order. If your order has multiple courses and one of them has not been updated with the download link, the status of the order is also Processing.
If the status is Completed: Your course is ready for immediate download. Click "VIEW" to view details and download the course.
Where can I find my course?
Once your order is complete, a link to download the course will automatically be sent to your email.
You can also get the download link by logging into your TradingAZ account then going to Downloads Page.


