Wyckoff Analytics – Point And Figure Part III
$299.00 $29.00
»Instant Delivery
Description
Wyckoff Analytics – Point And Figure Part III
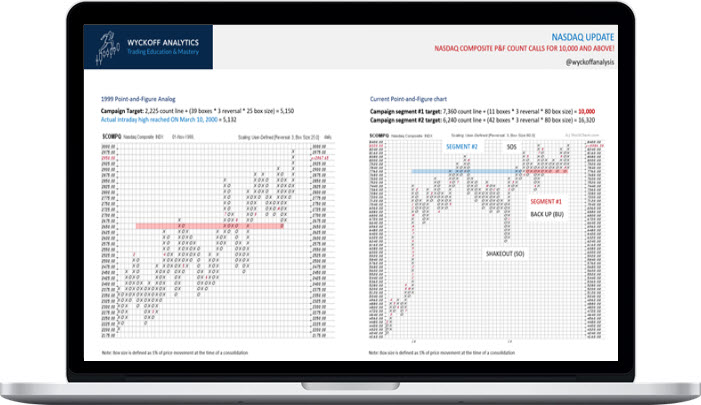
Wyckoff’s Law of Cause and Effect forms the foundation for his exceptional method of estimating price objectives using Point-and-Figure (P&F) charts. The underlying concept is deceptively simple, with the Cause equaling the horizontal P&F count in a trading range, which in turn generates an Effect or price target from the resulting trend. To obtain consistently reliable results with Wyckoff P&F charting, however, traders need a systematic approach, with guidelines that accommodate differences in trading range structures and timeframes.
We provided just such an approach, including some advanced and relatively new refinements, in our prior Point-and-Figure courses, which are among the most popular of all our on-demand courses. Point-and-Figure Part III, was developed in response to many student requests for additional applications of this remarkably versatile tool.
Point And Figure Part III course will include a review of some P&F fundamentals, followed by more advanced techniques.
What You’ll Learn In Point And Figure Part III?
Week #1: Point-and-Figure Foundations and More
During the first session, we will review and expand on the materials presented in our prior courses, including how to:
- Construct Wyckoff P&F charts using the StockCharts.com platform.
- Identify the correct count line in different trading range configurations (i.e., upsloping and down-sloping TRs as well as traditional horizontal consolidations).
- Apply refined horizontal P&F count guidelines to project price target zones, including how and when it’s appropriate to re-do counts and sequentially incorporate P&F phases.
- Determine when to use 1-box vs 3-box vs 5-box reversal techniques.
- Create and properly employ modified counts (using average true range and user-defined as well as traditional box sizes) and different scaling.
- Anticipate confirmation of projected price targets and resumption of a trend through stepping-stone counts.
- Take counts and project downside targets during distributional trading ranges, including critical differences in counting conventions and trading tactics in relation to accumulation.
- Contextualize Wyckoff’s Law of Cause and Effect to help you understand how and why this seemingly “magical” P&F technique produces such consistently accurate projections in any timeframe.
Week #2: Practical Applications in Multiple Timeframes
In the second session, we will apply the materials from Week #1 to illustrate:
- The usefulness of intraday P&F counts in short-term swing trading and in reliably anticipating near-term price movement on longer timeframes.
- Trading tactics throughout an entire trend based on long-term campaign counts.
- Refining timing and trade management from swing P&F (confirming) counts.
- Tape reading and trading off P&F charts – this is all-new content not available anywhere else, which should be particularly valuable for short-term traders.
Week #3: Advanced Point-and-Figure Techniques
In our Wyckoff Market Discussions, many students have asked about Bruce’s cutting-edge P&F analyses of individual securities and market breadth. In this session, we will present how to incorporate these methods into your trading. Specifically, we will demonstrate, step-by-step, how to:
- Utilize P&F as a convincer strategy in assessing a security’s relative strength in relation to any other market, including its peers, sector, industry group and the overall market.
- Apply and interpret percentage-scaled box sizes, which are particularly valuable in comparing multiple instruments.
- Evaluate the overall status of any market using Bruce’s adaptation of the Bullish Percentage, an indicator based on P&F charts of the components of any index.
More courses from the same author: Wyckoff Analytics
Delivery Policy
When will I receive my course?
You will receive a link to download your course immediately or within 1 to 21 days. It depends on the product you buy, so please read the short description of the product carefully before making a purchase.
How is my course delivered?
We share courses through Google Drive, so once your order is complete, you'll receive an invitation to view the course in your email.
To avoid any delay in delivery, please provide a Google mail and enter your email address correctly in the Checkout Page.
In case you submit a wrong email address, please contact us to resend the course to the correct email.
How do I check status of my order?
Please log in to TradingAZ account then go to Order Page. You will find all your orders includes number, date, status and total price.
If the status is Processing: Your course is being uploaded. Please be patient and wait for us to complete your order. If your order has multiple courses and one of them has not been updated with the download link, the status of the order is also Processing.
If the status is Completed: Your course is ready for immediate download. Click "VIEW" to view details and download the course.
Where can I find my course?
Once your order is complete, a link to download the course will automatically be sent to your email.
You can also get the download link by logging into your TradingAZ account then going to Downloads Page.

